FRIDAY, MAY 17, 2019: NOTE TO FILE

Nature’s Dangerous Decline ‘Unprecedented’
Species Extinction Rates ‘Accelerating’ - Current global response insufficient
Eric Lee, A-SOCIATED PRESS
TOPICS: EXTINCTION, FROM THE WIRES, SOME SPECIES WILL LIKELY SURVIVE
Abstract: Yet another warning (with nearly 15,000 references) the true believers of the world will consider and say, "Yes, all true, but..." followed by fine words that won't matter. Wordsmiths of the world are adept at numerous sleight of mind tricks. Some will politicize the warning to further their putative "solutions." Meanwhile the CDC reports that the American birth rate is the lowest it has been in 32 years. Anthropocene enthusiasts are deeply concerned. See page one.
COOS BAY (A-P) — Meanwhile, on page 28 of global media coverage of the state of the world, the 1,500 page UN (IPBES) report links to the 40-page summary that maybe 0.001% of humans will actually read (but probably not spend too much time thinking about). Some highlights:
- Three-quarters of the land-based environment and about two-thirds of the marine environment have been significantly altered by human actions. On average these trends have been less severe or avoided in areas held or managed by Indigenous Peoples and Local Communities [i.e. the marginalized living on the edge of industrial society are less empowered to alter their environment].
- More than a third of the world’s land surface and nearly 75% of freshwater resources are now devoted to crop or livestock production [and much of the 25% is used to support urban and industrial sprawl, e.g. 130 gals/day/person for those living in Tucson AZ at the end of a 330 mile canal delivering water pumped 2,000 ft uphill from the Colorado River thanks to coal fired power plants].
- The value of agricultural crop production has increased by about 300% since 1970 [as fossil fuels are turned into food], raw timber harvest has risen by 45% and approximately 60 billion tons of renewable and nonrenewable resources are now extracted globally every year – having nearly doubled since 1980.
- Land degradation has reduced the productivity of 23% of the global land surface, up to US$577 billion in annual global crops are at risk from pollinator loss and 100-300 million people are at increased risk of floods and hurricanes because of loss of coastal habitats and protection.
- In 2015, 33% of marine fish stocks were being harvested at unsustainable levels; 60% were maximally sustainably fished, with just 7% harvested at levels lower than what can be sustainably fished [e.g. surf perch in Oregon which cannot be commercially fished (yet)].
- Urban areas have more than doubled since 1992 [the year of the first World Scientists' Warning to Humanity].
- Plastic pollution has increased tenfold since 1980, 300-400 million tons of heavy metals, solvents, toxic sludge and other wastes from industrial facilities are dumped annually into the world’s waters, and fertilizers entering coastal ecosystems have produced more than 400 ocean ‘dead zones’, totalling more than 245,000 km2 (591-595) - a combined area greater than that of the United Kingdom [or Michigan].
- Negative trends in nature will continue to 2050 and beyond in all of the policy scenarios explored in the Report, except those that include transformative change – due to the projected impacts of [1] increasing land-use change [e.g. agriculture, urban/industrial sprawl — by far the major cause of bio-diversity loss and mass], [2] exploitation of organisms and [3] climate change, although with significant differences between regions.
Life on Earth is the canary in our coal mine. The turning point (averaged slope >45 degrees, two hundred years before the Great Acceleration) coincides with the beginnings of the Industrial Revolution. But as Anthropocene Enthusiasts note, that is surely correlation, not causation. There is no convincing evidence that species extinction is caused by humans. But climate change is [isn't], so vote for ____ who has real solutions.
By the Numbers – Key Statistics and Facts from the Intergovernmental Science-Policy Platform on Biodiversity and Ecosystem Services (IPBES) Report
On Monday March 6th, 2019, the UN’s IPBES Global Assessment was released. This is the most comprehensive and authoritative assessment of Nature and its contributions to people—ever. The Assessment’s findings are compelling. Climate change is just the tip of the iceberg when it comes to global environmental challenges.
General
- 75%: terrestrial environment “severely altered” to date by human actions (marine environments 66%)
- 47%: reduction in global indicators of ecosystem extent and condition against their estimated natural baselines, with many continuing to decline by at least 4% per decade
- 28%: global land area held and/or managed by Indigenous Peoples , including >40% of formally protected areas and 37% of all remaining terrestrial areas with very low human intervention
- +/-60 billion: tons of renewable and non-renewable resources extracted globally each year, up nearly 100% since 1980
- 15%: increase in global per capita consumption of materials since 1980
- >85%: of wetlands present in 1700 had been lost by 2000 – loss of wetlands is currently three times faster, in percentage terms, than forest loss.
Species, Populations and Varieties of Plants and Animals
- 8 million: total estimated number of animal and plant species on Earth (including 5.5 million insect species)
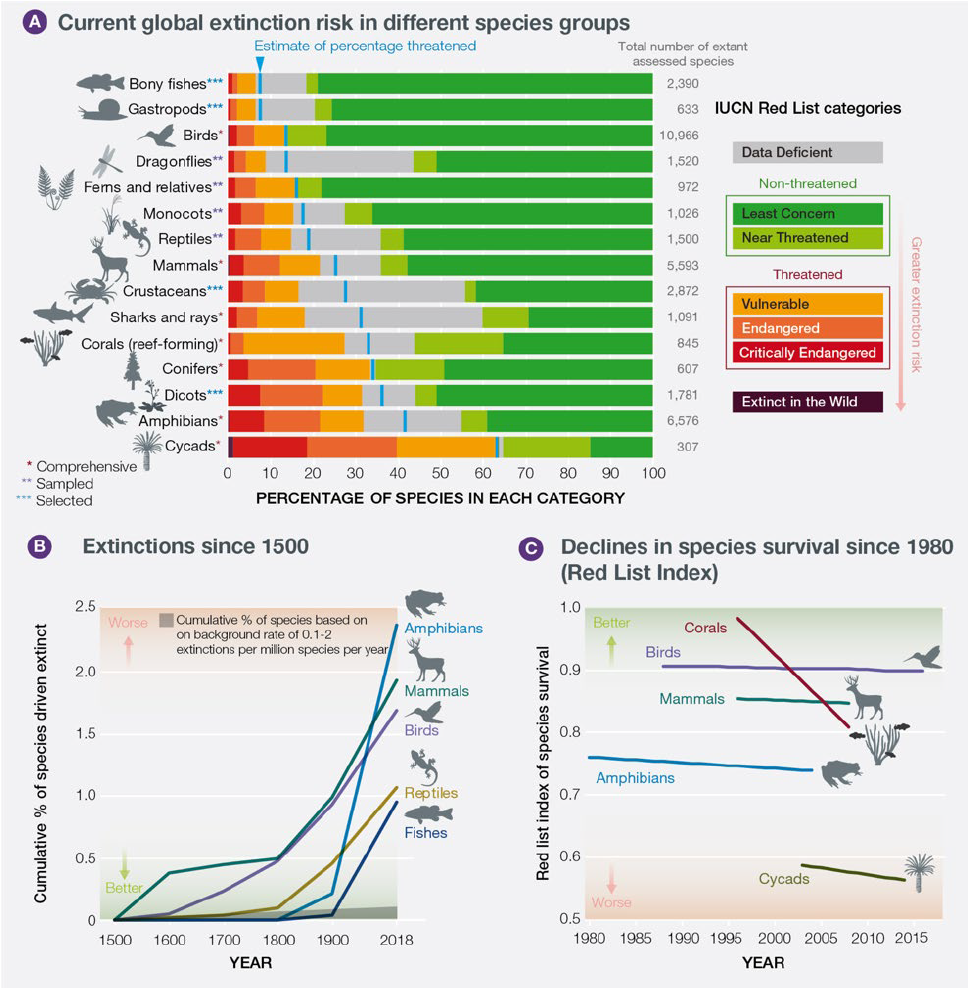
- Tens to hundreds of times: the extent to which the current rate of global species extinction is higher compared to average over the last 10 million years, and the rate is accelerating
- Up to 1 million: species threatened with extinction, many within decades
- >500,000 (+/-9%): share of the world’s estimated 5.9 million terrestrial species with insufficient habitat for long term survival without habitat restoration
- >40%: amphibian species threatened with extinction
- Almost 33%: reef forming corals, sharks and shark relatives, and >33% marine mammals threatened with extinction
- 25%: average proportion of species threatened with extinction across terrestrial, freshwater and marine vertebrate, invertebrate and plant groups that have been studied in sufficient detail
- At least 680: vertebrate species driven to extinction by human actions since the 16th century
- +/-10%: tentative estimate of proportion of insect species threatened with extinction
- >20%: decline in average abundance of native species in most major terrestrial biomes, mostly since 1900
+/-560 (+/-10%): domesticated breeds of mammals were extinct by 2016, with at least 1,000 more threatened - 3.5%: domesticated breed of birds extinct by 2016
- 70%: increase since 1970 in numbers of invasive alien species across 21 countries with detailed records
- 30%: reduction in global terrestrial habitat integrity caused by habitat loss and deterioration
- 47%: proportion of terrestrial flightless mammals and 23% of threatened birds whose distributions may have been negatively impacted by climate change already
Food and Agriculture
- 300%: increase in food crop production since 1970
- 23%: land areas that have seen a reduction in productivity due to land degradation
- >75%: global food crop types that rely on animal pollination
- US$235 to US$577 billion: annual value of global crop output at risk due to pollinator loss
- 5.6 gigatons: annual CO2 emissions sequestered in marine and terrestrial ecosystems – equivalent to 60% of global fossil fuel emission
- +/-11%: world population that is undernourished
- 100 million: hectares of agricultural expansion in the tropics from 1980 to 2000, mainly cattle ranching in Latin America (+/-42 million ha), and plantations in Southeast Asia (+/-7.5 million ha, of which 80% is oil palm), half of it at the expense of intact forests
- 3%: increase in land transformation to agriculture between 1992 and 2015, mostly at the expense of forests
- >33%: world’s land surface (and +/-75% of freshwater resources) devoted to crop or livestock production
- 12%: world’s ice-free land used for crop production
- 25%: world’s ice-free land used for grazing (+/-70% of drylands)
- +/-25%: greenhouse gas emissions caused by land clearing, crop production and fertilization, with animal-based food contributing 75% to that figure
- +/-30%: global crop production and global food supply provided by small land holdings (<2 ha), using +/-25% of agricultural land, usually maintaining rich agrobiodiversity
- $100 billion: estimated level of financial support in OECD countries (2015) to agriculture that is potentially harmful to the environment
Oceans and Fishing
- 33%: marine fish stocks in 2015 being harvested at unsustainable levels; 60% are maximally sustainably fished; 7% are underfished
- >55%: ocean area covered by industrial fishing
- 3-10%: projected decrease in ocean net primary production due to climate change alone by the end of the century
- 3-25%: projected decrease in fish biomass by the end of the century in low and high climate warming scenarios, respectively
- >90%: proportion of the global commercial fishers accounted for by small scale fisheries (over 30 million people) – representing nearly 50% of global fish catch
- Up to 33%: estimated share in 2011 of world’s reported fish catch that is illegal, unreported or unregulated
- >10%: decrease per decade in the extent of seagrass meadows from 1970-2000
- +/-50%: live coral cover of reefs lost since 1870s
- 100-300 million: people in coastal areas at increased risk due to loss of coastal habitat protection
- 400: low oxygen (hypoxic) coastal ecosystem ‘dead zones’ caused by fertilizers, affecting >245,000 km2
- 29%: average reduction in the extinction risk for mammals and birds in 109 countries thanks to conservation investments from 1996 to 2008; the extinction risk of birds, mammals and amphibians would have been at least 20% greater without conservation action in recent decade
- >107: highly threatened birds, mammals and reptiles estimated to have benefitted from the eradication of invasive mammals on islands
Forests
- 45%: increase in raw timber production since 1970 (4 billion cubic meters in 2017)
- +/-13 million: forestry industry jobs
- 50%: agricultural expansion that occurred at the expense of forests
- 50%: decrease in net rate of forest loss since the 1990s (excluding those managed for timber or agricultural extraction)
- 68%: global forest area today compared with the estimated pre-industrial level
- 7%: reduction of intact forests (>500 sq. km with no human pressure) from 2000-2013 in developed and developing countries
- 290 million ha (+/-6%): native forest cover lost from 1990-2015 due to clearing and wood harvesting
- 110 million ha: rise in the area of planted forests from 1990-2015
- 10-15%: global timber supplies provided by illegal forestry (up to 50% in some areas)
- >2 billion: people who rely on wood fuel to meet their primary energy needs
Mining and Energy
- <1%: total land used for mining, but the industry has significant negative impacts on biodiversity, emissions, water quality and human health
- +/-17,000: large-scale mining sites (in 171 countries), mostly managed by 616 international corporations
- +/-6,500: offshore oil and gas ocean mining installations ((in 53 countries)
- US$345 billion: global subsidies for fossil fuels resulting in US$5 trillion in overall costs, including nature deterioration externalities; coal accounts for 52% of post-tax subsidies, petroleum for +/-33% and natural gas for +/-10%
Urbanization, Development and Socioeconomic Issues
- >100%: growth of urban areas since 1992
- 25 million km: length of new paved roads foreseen by 2050, with 90% of construction in least developed and developing countries
- +/-50,000: number of large dams (>15m height) ; +/-17 million reservoirs (>0.01 ha)
- 105%: increase in global human population (from 3.7 to 7.6 billion) since 1970 unevenly across countries and regions
- 50 times higher: per capita GDP in developed vs. least developed countries
- >2,500: conflicts over fossil fuels, water, food and land currently occurring worldwide
- >1,000: environmental activists and journalists killed between 2002 and 2013
Health
- 70%: proportion of cancer drugs that are natural or synthetic products inspired by nature
- +/-4 billion: people who rely primarily on natural medicines
- 17%: infectious diseases spread by animal vectors, causing >700,000 annual deaths
- +/-821 million: people face food insecurity in Asia and Africa
- 40%: of the global population lacks access to clean and safe drinking water
- >80%: global wastewater discharged untreated into the environment
- 300-400 million tons: heavy metals, solvents, toxic sludge, and other wastes from industrial facilities dumped annually into the world’s waters
- 10 times: increase in plastic pollution since 1980
Climate Change
- 1 degree Celsius: average global temperature difference in 2017 compared to pre-industrial levels, rising +/-0.2 (+/-0.1) degrees Celsius per decade
- >3 mm: annual average global sea level rise over the past two decades
- 16-21 cm: rise in global average sea level since 1900
- 100% increase since 1980 in greenhouse gas emissions, raising average global temperature by at least 0.7 degree
- 40%: rise in carbon footprint of tourism (to 4.5Gt of carbon dioxide) from 2009 to 2013
- 8%: of total greenhouse gas emissions are from transport and food consumption related to tourism
- 5%: estimated fraction of species at risk of extinction from 2°C warming alone, rising to 16% at 4.3°C warming
- Even for global warming of 1.5 to 2 degrees, the majority of terrestrial species ranges are projected to shrink profoundly.
Global Goals
- Most: Aichi Biodiversity Targets for 2020 likely to be missed
- 22 of 44: assessed targets under the Sustainable Development Goals related to poverty, hunger, health, water, cities, climate, ocean and land are being undermined by substantial negative trends in nature and its contributions to people
- 72%: of local indicators in nature developed and used by Indigenous Peoples and Local Communities that show negative trends
- 4: number of Aichi Targets where good progress has been made on certain components, with moderate progress on some components of another 7 targets, poor progress on all components of 6 targets, and insufficient information to assess progress on some or all components of the remaining 3 targets
Progress Report towards The Aichi Biodiversity Targets 2016